


Breaking the Jargons #1: May Edition
Machine Learning Interpretability, Decision Tree visualisation and more


Hi there!
Welcome to the first edition of this newsletter. I share a lot of stuff via Medium, Linkedin and sometimes Twitter. The idea of this newsletter is to consolidate them together and share them with others. This edition includes some interesting articles I wrote, ranging from data visualization to machine learning interpretability. Here is a quick recap of them.
📜 Articles
Here are the articles published in May:
A common notion in the machine learning community is that a trade-off exists between accuracy and interpretability. However, of late, there has been a lot of emphasis on creating inherently interpretable models and doing away from their black box counterparts. This article looks at the idea behind EBMs - models designed to have accuracy comparable to state-of-the-art machine learning methods like Random Forest and Boosted Trees while being highly intelligible and explainable.
Scikit-learn library inherently comes with the plotting capability for decision trees via the sklearn.tree.export_graphviz function. However, there are some inconsistencies with the default option. This article looks at an alternative called dtreeviz that renders better-looking and intuitive visualizations while offering greater interpretability options.
This article is about making the most of Google Colab notebooks. Colab is a boon for Deep learning enthusiasts on a budget. This article compiles some useful tips and hacks that I use to get my work done in Colab. I have tried to list most of the sources where I read them first. Hopefully, these tricks should help you to make the most of your Colab notebooks.
Statistical tests and analysis can be confounded by a simple misunderstanding of the data. In this article, we look at a statistical phenomenon called ‘Simpson’s Paradox.’ The paradox implies that the same data set can show opposite trends depending on how it’s grouped. This effect can sometimes evade our eyes and present dubious results like the year 1314 study showing smokers tend to live more.
The choice of visualization tool at times is more complicated than the task itself. On the one hand, we have libraries that are easier to use but are not so helpful in showing complex relationships in data. Then others render interactivity but have a considerable learning curve. What if we can get interactive and superior visualizations but with minimalist effort? Well, this is possible. In this article, I summarize ways to create Plotly and Bokeh plots directly with the Pandas index, effortlessly.
🎙️ Interviews
I interviewed Guanshuo Xu: A Data Scientist, Kaggle Competitions Grandmaster(Rank 1), and a Ph.D. in Electrical Engineering to know more about him and his approach to participating in Kaggle competitions. The Kaggle platform is so competitive that another Kaggler(Bestfitting) overtook him for the top-ranking position after a few days of publishing the interview. But he will surely bounce back as he did the last time when Philip became world No 1.
🔬 Research Papers Recommendations
Some research papers that you would find interesting
EfficientNets are known to achieve both higher accuracy and better efficiency over existing CNNs. This was achieved by first developing a robust baseline network using neural architecture search(NAS) followed by the Compound Scaling method. The main building block for EfficientNet is MBConv, an inverted residual block.
Now, EfficientNetV2 has been released. According to the authors, they train much faster than SOTA models while being up to 6.8x smaller. Infact they have achieved better results on ImageNet than recently published NFNets, Vision Transformers, etc.
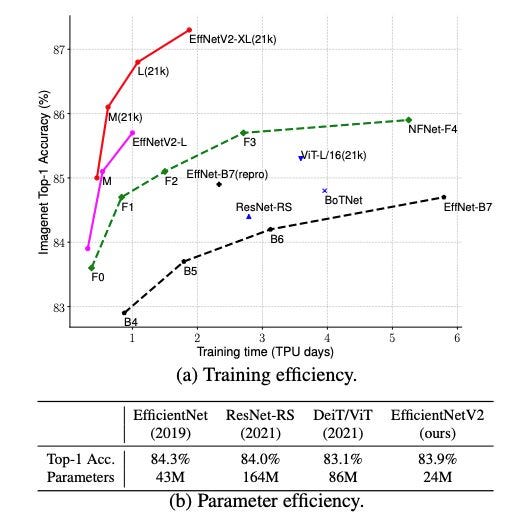
EfficientNetV2 uses the concept of progressive learning, i.e., adaptively adjusting regularization with image size, Fused-MB Conv layers over MB Conv layers, and a non-uniform scaling strategy.
🎁 Resources of the Month

The scikit-learn team has created an outstanding MOOC for getting started with scikit-learn. It is a combination of video lessons, programming notebooks, and quizzes. This MOOC is accessible to anybody with basic Python programming skills.
Schedule and registration
Registration: April 19th - July 13rd 2021
Courses: May 18th - July 14th, 2021
That is all for this edition. See you with another roundup, next month. You can subscribe to receive newsletters directly in your mailbox, every month.
Until next time,
Parul
Thanks for sharing such an amazing list of articles.
Thank you for sharing, Parul. Looking forward to next edition :)